Test 2 IT: Introduction to ROS2
1. Introduction and Objectives
Introduction:
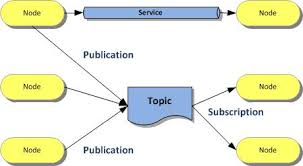
This project is part of an initiation test to ROS2, a modern and powerful framework for robotics and distributed systems. The objective is to discover, through concrete practice, the fundamental mechanisms of ROS2: publishing, subscribing, and inter-node communication via topics.
Pedagogical and Technical Objectives:
- Understand the structure of a ROS2 package and best practices for code organization.
- Implement a publisher node that generates and publishes at regular intervals (0.5 s) simulated sensor data (temperature, humidity, pressure) on a dedicated topic.
- Implement a subscriber node that receives this data, checks its validity against predefined ranges, and logs the result (valid/out of range).
- Create a launch file to facilitate the simultaneous execution of nodes.
- Gain first-hand experience with asynchronous communication and message handling in ROS2.
This test forms an essential foundation for any further development in ROS2 robotics, and allows acquiring the necessary reflexes for designing robust, scalable, and interoperable systems.
Note: Advanced features (history, statistics, web dashboard, etc.) are personal additions to enrich the experience, but are not required in the basic test.
2. Installing ROS2 Humble on Ubuntu 22.04 (Essential Step)
Before any code implementation, it is imperative to correctly install ROS2 Humble on Ubuntu 22.04.
Why is this step crucial?
ROS2 is a complex framework that heavily depends on the operating system version and the installed distribution. ROS2 Humble is officially supported and tested on Ubuntu 22.04. Any attempt to install on another Ubuntu version or another OS may lead to incompatibilities, compilation errors, or malfunctions of nodes and ROS2 tools.WARNING
⚠️ Without a clean installation of ROS2 Humble on Ubuntu 22.04, it is impossible to guarantee the proper functioning of ros2 commands, package compilation, or communication between nodes. :::
This step conditions the success of the entire project:
- Publisher and subscriber nodes cannot be launched if ROS2 is not installed or misconfigured.
- The launch file will not work without the ROS2 environment initialized.
- Build tools (
colcon,ament) and Python/C++ dependencies are managed by ROS2.- Documentation, tutorials, and the community are centered on this version.
In summary: Always start by installing ROS2 Humble on Ubuntu 22.04, verify that the
ros2 --versioncommand works, and source the environment before writing or executing any code.
Update your system:
sudo apt update && sudo apt upgrade -yConfigure the locale:
sudo apt install locales
sudo locale-gen en_US en_US.UTF-8
sudo update-locale LC_ALL=en_US.UTF-8 LANG=en_US.UTF-8
export LANG=en_US.UTF-8
Add ROS2 sources:
sudo apt install software-properties-common
sudo add-apt-repository universe
sudo apt update && sudo apt install curl -y
sudo curl -sSL https://raw.githubusercontent.com/ros/rosdistro/master/ros.key -o /usr/share/keyrings/ros-archive-keyring.gpg
echo "deb [arch=$(dpkg --print-architecture) signed-by=/usr/share/keyrings/ros-archive-keyring.gpg] http://packages.ros.org/ros2/ubuntu $(lsb_release -cs) main" | sudo tee /etc/apt/sources.list.d/ros2.list > /dev/null
Install ROS2 Humble:
sudo apt update
sudo apt install ros-humble-desktop python3-argcomplete -y
Initialize the environment:
echo "source /opt/ros/humble/setup.bash" >> ~/.bashrc
source ~/.bashrc
Verify the installation:
ros2 --version
Tip: For more details, consult the official ROS2 Humble documentation.
In case of problems: Consult ROS Answers forums, Ubuntu documentation, or ask the community for help before going further in development.
3. Structure of the sensor_data_evaluation folder (real example of the project)
Here is the real structure of the sensor_data_evaluation folder in this project, which contains the ROS2 package and all associated files:
sensor_data_evaluation/
├── build/                         # Build folders generated by colcon
├── install/                       # Installation folders generated by colcon
├── log/                           # Build logs colcon
├── logs/                          # CSV data and statistics files
│   ├── sensor_data_received.csv
│   └── sensor_stats_python.csv
├── sensor_data_evaluation/        # Main ROS2 package
│   ├── package.xml
│   ├── setup.py / setup.cfg
│   ├── TEST.md                    # Test documentation
│   ├── web_monitor.py             # Flask backend for dashboard
│   ├── launch/
│   │   └── sensor_data_launch.py  # ROS2 launch file
│   ├── resource/
│   │   └── sensor_data_evaluation # ROS2 resource file
│   ├── sensor_data_evaluation/
│   │   ├── __init__.py
│   │   ├── sensor_data_publisher.py   # Publisher node
│   │   ├── sensor_data_subscriber.py  # Subscriber node
│   │   └── sensor_stats_node.py       # Statistics node
│   ├── templates/
│   │   └── monitor.html               # Web dashboard
└── ... (other automatically generated folders)- logs/: contains CSV files generated by nodes (history, statistics).
- sensor_data_evaluation/: complete ROS2 package with source code, launch, resources, templates, test documentation, and web backend.
- build/, install/, log/: automatically generated during compilation with
colcon build.
Why this structure?
This organization respects ROS2 standards: each package must contain a package.xml file, a setup.py (for Python), a resource/ folder (for package registration), and optionally launch/ for launch files. This ensures compatibility with ROS2 tools (colcon build, ros2 run, etc.), portability, and maintainability of the project. The logs/ and templates/ folders facilitate traceability and the web interface.
4. Detailed Features
4.1 Publisher Node
Role: This node simulates a sensor by generating every 0.5 s random values of temperature (14.8–35.2°C), humidity (29.8–70.2%), and pressure (949.5–1050.5hPa), covering slightly beyond normal ranges to test system robustness. Values are published on the /sensor_data topic as an array of three floats.
Usefulness: Test the ROS2 chain without real hardware, validate anomaly detection, and system responsiveness.
Key Points: Regular publication, realistic generation, intentional range extension to simulate edge cases.
4.2 Subscriber Node
Role: Receives each message, checks if each value is within the expected range (15–35°C, 30–70%, 950–1050hPa), logs "Valid" or "Out of range" in the console, and records each measurement in logs/sensor_data_received.csv with date and time.
Usefulness: Traceability, immediate anomaly detection, building an exploitable history.
Key Points: Automatic verification, detailed logging, CSV recording, easily modifiable ranges in the code.
4.3 Statistics Node
Role: Calculates in real-time the average, min, and max for each sensor with each new data received, and updates logs/sensor_stats_python.csv.
Usefulness: Synthetic view of system status, detection of drifts or anomalies over time.
Key Points: Automatic calculations, CSV storage, separate stats per sensor, easy to extend.
4.4 Flask Web Dashboard
Role: Modern web interface displaying in real-time curves, histograms, tables, statistics, and alerts (out-of-range values) from generated CSVs.
Usefulness: Remote visualization, quick anomaly identification, graph export, professional user experience.
Key Points: Automatic refresh (WebSocket), dark mode, responsive, visual signaling, PNG export, easy to customize.
5. Overall Operation Diagram
+-------------------+        +---------------------+
| sensor_data_      |        | sensor_data_        |
| publisher (Node)  |----->  | subscriber (Node)   |
|  (random data)    |        |  (check, log, CSV)  |
+-------------------+        +---------------------+
         |                           |
         |                           |
         |                           v
         |                 +---------------------+
         |                 | sensor_stats_node   |
         |                 | (stats, log, CSV)   |
         |                 +---------------------+
         |                           |
         |                           v
         v                           v
+-----------------------------------------------+
|         CSV Files (logs/)                     |
+-----------------------------------------------+
         |
         v
+-------------------+
|  Flask server     |
|  (web_monitor.py) |
+-------------------+
         |
         v
+-------------------+
| Web Dashboard     |
| (monitor.html)    |
+-------------------+
6. Preview of Main Nodes Code
Publisher Node Code (sensor_data_publisher.py)
import rclpy
from rclpy.node import Node
from std_msgs.msg import Float32MultiArray
import random

class SensorDataPublisher(Node):
    def __init__(self):
        super().__init__('sensor_data_publisher')
        self.publisher_ = self.create_publisher(Float32MultiArray, '/sensor_data', 10)
        self.timer = self.create_timer(0.5, self.publish_sensor_data)
        self.get_logger().info('SensorDataPublisher node started.')

    def publish_sensor_data(self):
        temperature = round(random.uniform(14.8, 35.2), 2)
        humidity = round(random.uniform(29.8, 70.2), 2)
        pressure = round(random.uniform(949.5, 1050.5), 2)
        msg = Float32MultiArray()
        msg.data = [temperature, humidity, pressure]
        self.publisher_.publish(msg)
        self.get_logger().info(f'Published: Temp={temperature:.2f}°C, Hum={humidity:.2f}%, Press={pressure:.2f}hPa')

def main(args=None):
    rclpy.init(args=args)
    node = SensorDataPublisher()
    rclpy.spin(node)
    node.destroy_node()
    rclpy.shutdown()

if __name__ == '__main__':
    main()
Subscriber Node Code (sensor_data_subscriber.py)
import rclpy
from rclpy.node import Node
from std_msgs.msg import Float32MultiArray
import os
import csv
from datetime import datetime

class SensorDataSubscriber(Node):
    def __init__(self):
        super().__init__('sensor_data_subscriber')
        self.subscription = self.create_subscription(
            Float32MultiArray,
            '/sensor_data',
            self.listener_callback,
            10)
        self.get_logger().info('SensorDataSubscriber node started.')
        self.csv_file = 'logs/sensor_data_received.csv'
        os.makedirs('logs', exist_ok=True)
        if not os.path.exists(self.csv_file):
            with open(self.csv_file, 'w', newline='', encoding='utf-8') as f:
                writer = csv.writer(f)
                writer.writerow(['Date', 'Time', 'Temperature', 'Humidity', 'Pressure'])

    def listener_callback(self, msg):
        temperature, humidity, pressure = msg.data
        temperature = float(f"{temperature:.2f}")
        humidity = float(f"{humidity:.2f}")
        pressure = float(f"{pressure:.2f}")
        now = datetime.now()
        date_str = now.strftime('%Y-%m-%d');
        time_str = now.strftime('%H:%M:%S');
        temp_ok = 15.0 <= temperature <= 35.0
        hum_ok = 30.0 <= humidity <= 70.0
        press_ok = 950.0 <= pressure <= 1050.0
        if temp_ok and hum_ok and press_ok:
            self.get_logger().info(f'Valid: Temp={temperature:.2f}°C, Hum={humidity:.2f}%, Press={pressure:.2f}hPa')
        else:
            self.get_logger().warn(f'Value out of range! Temp={temperature:.2f}°C, Hum={humidity:.2f}%, Press={pressure:.2f}hPa')
        # Save to CSV
        with open(self.csv_file, 'a', newline='', encoding='utf-8') as f:
            writer = csv.writer(f)
            writer.writerow([date_str, time_str, temperature, humidity, pressure])
Statistics Node Code (sensor_stats_node.py)
import rclpy
from rclpy.node import Node
from std_msgs.msg import Float32MultiArray
import os
import csv
from datetime import datetime

class SensorStatsNode(Node):
    def __init__(self):
        super().__init__('sensor_stats_node')
        self.subscription = self.create_subscription(
            Float32MultiArray,
            '/sensor_data',
            self.listener_callback,
            10)
        self.count = 0
        self.temp_sum = 0.0
        self.hum_sum = 0.0
        self.press_sum = 0.0
        self.temp_min = None
        self.temp_max = None
        self.hum_min = None
        self.hum_max = None
        self.press_min = None
        self.press_max = None
        self.csv_file = 'logs/sensor_stats_python.csv'
        os.makedirs('logs', exist_ok=True)
        if not os.path.exists(self.csv_file):
            with open(self.csv_file, 'w', newline='', encoding='utf-8') as f:
                writer = csv.writer(f)
                writer.writerow(['Date', 'Time', 'Nb values', 'Temp Avg', 'Temp Min', 'Temp Max', 'Hum Avg', 'Hum Min', 'Hum Max', 'Press Avg', 'Press Min', 'Press Max'])

    def listener_callback(self, msg):
        temperature, humidity, pressure = msg.data
        self.count += 1
        self.temp_sum += temperature
        self.hum_sum += humidity
        self.press_sum += pressure
        self.temp_min = temperature if self.temp_min is None else min(self.temp_min, temperature)
        self.temp_max = temperature if self.temp_max is None else max(self.temp_max, temperature)
        self.hum_min = humidity if self.hum_min is None else min(self.hum_min, humidity)
        self.hum_max = humidity if self.hum_max is None else max(self.hum_max, humidity)
        self.press_min = pressure if self.press_min is None else min(self.press_min, pressure)
        self.press_max = pressure if self.press_max is None else max(self.press_max, pressure)
        now = datetime.now()
        date_str = now.strftime('%Y-%m-%d');
        time_str = now.strftime('%H:%M:%S');
        with open(self.csv_file, 'a', newline='', encoding='utf-8') as f:
            writer = csv.writer(f)
            writer.writerow([
                date_str, time_str, self.count,
                round(self.temp_sum/self.count,2), round(self.temp_min,2), round(self.temp_max,2),
                round(self.hum_sum/self.count,2), round(self.hum_min,2), round(self.hum_max,2),
                round(self.press_sum/self.count,2), round(self.press_min,2), round(self.press_max,2)
            ])
Web Dashboard Code (web_monitor.py)
from flask import Flask, render_template, jsonify
from flask_socketio import SocketIO, emit
import pandas as pd
import os

app = Flask(__name__)
socketio = SocketIO(app, cors_allowed_origins="*")

@app.route('/')
def index():
    return render_template('monitor.html')

@app.route('/data')
def data():
    # Read the last line of sensor_data_received.csv
    csv_path = os.path.join(os.path.dirname(__file__), '..', 'logs', 'sensor_data_received.csv')
    try:
        with open(csv_path, 'r') as f:
            lines = f.readlines()
            if len(lines) < 2:
                return jsonify({'temperature': None, 'humidity': None, 'pressure': None})
            last = lines[-1].strip().split(',')
            # Format: date,time,temp,hum,pres
            return jsonify({
                'temperature': float(last[2]),
                'humidity': float(last[3]),
                'pressure': float(last[4])
            })
    except Exception as e:
        return jsonify({'temperature': None, 'humidity': None, 'pressure': None})

@socketio.on('request_data')
def handle_request_data():
    csv_path = os.path.join(os.path.dirname(__file__), '..', 'logs', 'sensor_data_received.csv')
    try:
        with open(csv_path, 'r') as f:
            lines = f.readlines()
            if len(lines) < 2:
                emit('sensor_data', {'temperature': None, 'humidity': None, 'pressure': None})
                return
            last = lines[-1].strip().split(',')
            emit('sensor_data', {
                'temperature': float(last[2]),
                'humidity': float(last[3]),
                'pressure': float(last[4])
            })
    except Exception as e:
        emit('sensor_data', {'temperature': None, 'humidity': None, 'pressure': None})
7. Web Interface (Dashboard)
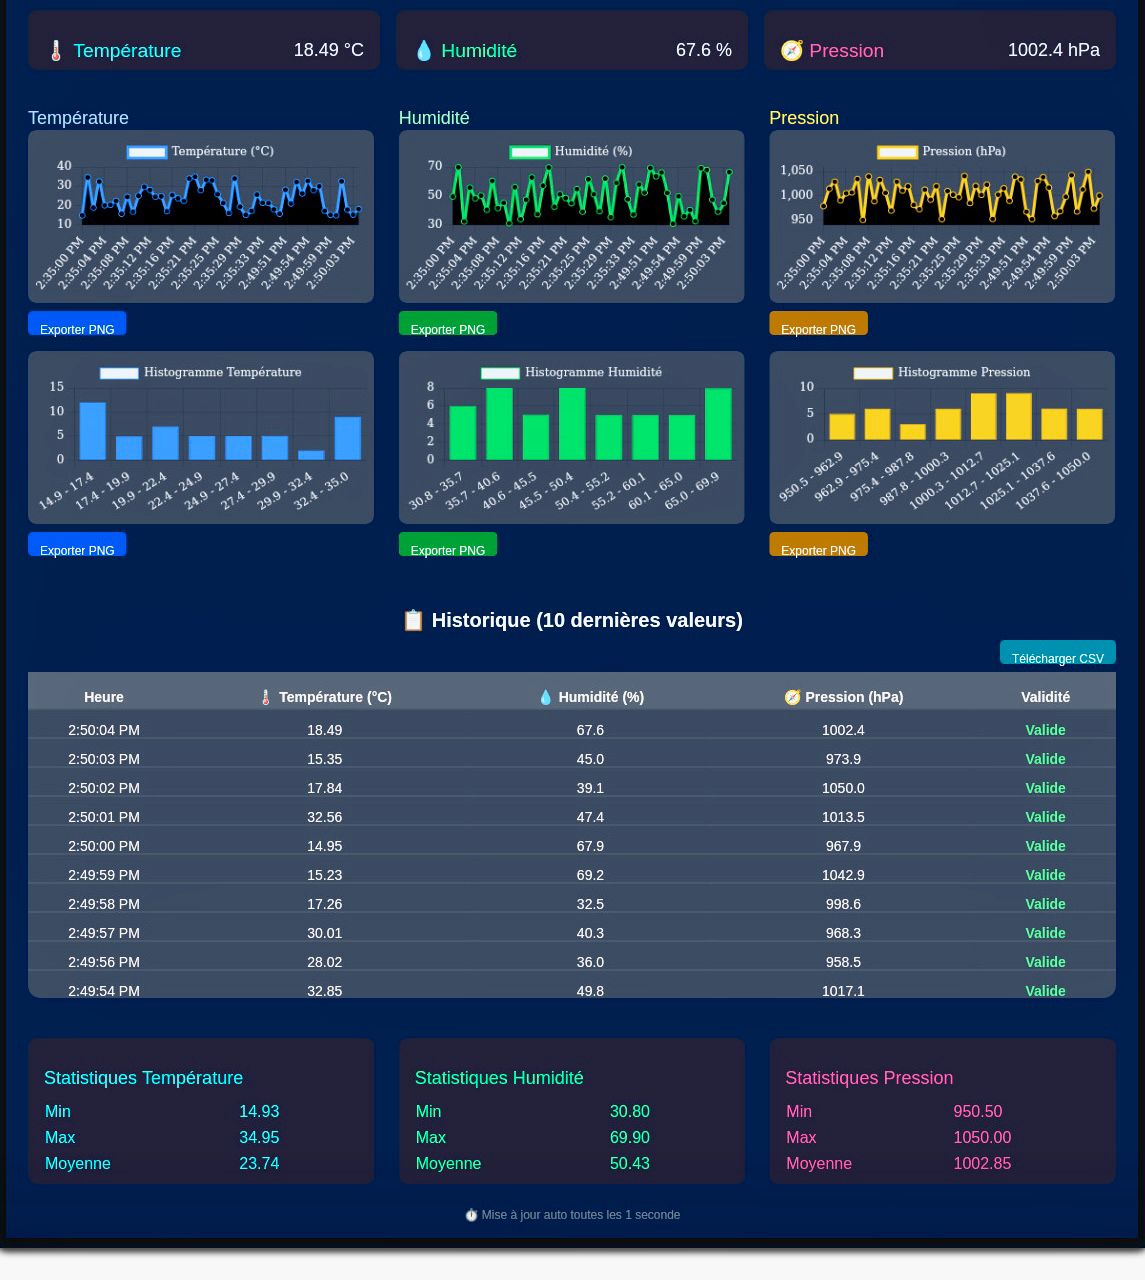
The web interface of the project, accessible via web_monitor.py, offers a modern and interactive dashboard for real-time visualization of sensor data and statistics. It was designed for a professional user experience, accessible on PC, tablet, or smartphone.
- Real-time visualization: curves, histograms, and tables update automatically thanks to WebSocket (SocketIO).
- Visual alerts: any out-of-range value is signaled by color code and animation.
- Dynamic statistics: display of averages, min, max, number of measurements, etc.
- Export: possibility to export graphs in PNG format and download CSVs.
- Responsive: optimized display for all screens.
- Easy customization: colors, thresholds, chart types modifiable in the code.
Tip: To customize the interface, modify
templates/monitor.html(HTML/JS) andweb_monitor.py(Flask backend).
8. Flask Server (Backend)
The Flask server (web_monitor.py) bridges the CSV files generated by ROS2 nodes and the web interface. To start the server and access the real-time dashboard, use the following command in a terminal:
python3 web_monitor.pyOnce the server is launched, open http://localhost:5000 in your browser to access the monitoring interface.
- CSV reading: the backend reads the
logs/sensor_data_received.csvandlogs/sensor_stats_python.csvfiles to provide data to the interface. - REST API: routes like
/dataor/statsreturn the latest values or statistics in JSON format. - WebSocket (SocketIO): allows instant update of graphs without reloading the page.
- Security: by default, access is open locally. For remote use, it is recommended to add authentication and switch to HTTPS.
- Extensibility: it is easy to add new routes (API, CSV download, etc.) or connect other data sources.
- Startup: launch the server with
python3 web_monitor.pythen openhttp://localhost:5000in a browser.
Best practices: Clearly separate backend logic (Flask) from presentation (HTML/JS). Use Python virtual environments to isolate dependencies.
9. Key Illustrations of the Project
9.1 Launching ROS2 Nodes
9.2 Generated CSV Files
9.3 Web Interface (Dashboard)
10. FAQ & Use Cases
FAQ:
- Q: Can I add other sensors?
A: Yes, modify the publisher and adapt the message/CSV. - Q: How to change validity ranges?
A: Useros2 param seton the subscriber node. - Q: Can I visualize the complete history?
A: Yes, open the CSV in Excel or develop a dedicated web page. - Q: How to export data?
A: Use the PNG export from the dashboard or download the CSV via Flask.
Use Cases:
- ROS2 educational demo (university, training, MOOC)
- Robustness tests of monitoring algorithms
- IoT/industrial supervision prototype
- Base for predictive analysis or AI project
11. Appendices & References
- Official ROS2 Humble Documentation
- Flask Documentation
- Flask-SocketIO Documentation
- Chart.js Documentation
- GitHub ROS2
- Appendices: CSV files (
logs/), Python source code, diagrams, and configuration examples in the repository.
12. Limitations and Perspectives
- Technical limitations: This project is designed for educational use and local demonstration. It is not optimized for high availability, network security, or handling very large data volumes.
- Scalability: The current architecture works for a few sensors and single-machine use. For industrial deployment or multi-sensor, it would be necessary to adapt topic management, data persistence, and supervision.
- Security: Remote access via Flask/ngrok is not secure by default. For production use, it is recommended to add authentication, encryption (HTTPS), and access restrictions.
- Perspectives: Possibility to add other sensor types, integrate a database, export to cloud, or add advanced analysis modules (AI, anomaly detection, automatic alerts, etc.).
- Possible improvements: Add automated tests, administration interface, multi-user management, internationalization, distributed monitoring, etc.
To Go Further
- Security: Add authentication, switch to HTTPS, restrict remote access.
- Deployment: Test on Raspberry Pi, containerize with Docker, host on cloud.
- Scalability: Manage multiple sensors, dynamic topics, database for history.
- Advanced Analysis: Integrate AI modules, anomaly detection, automatic alerts.
- Interface: Add advanced graphs, export to Excel, internationalize documentation.
- Tests: Set up automated tests, CI/CD, distributed monitoring.
Summary Table of Main Commands
| Command | Description |
|---|---|
colcon build --packages-select sensor_data_evaluation | Compile the ROS2 package |
source install/setup.bash | Activate the ROS2 environment |
ros2 launch sensor_data_evaluation sensor_data_launch.py | Launch all nodes via the launch file |
ros2 run sensor_data_evaluation sensor_data_publisher | Launch the publisher node alone |
ros2 run sensor_data_evaluation sensor_data_subscriber | Launch the subscriber node alone |
ros2 run sensor_data_evaluation sensor_stats_node | Launch the statistics node alone |
python3 web_monitor.py | Launch the Flask web server (dashboard) |